

XRP 2017 Rally Signal Returns: Is History About to Repeat in 2025?
The XRP 2017 Rally Signal is remembered as one of the most powerful triggers in crypto history. In 2017, it sparked a legendary XRP bull run that transformed the token from an overlooked digital asset into a global talking point. Prices skyrocketed within months, driven by momentum that few expected, and the 2017 rally pattern became a benchmark for traders studying explosive growth cycles in digital currencies. That rally didn’t just change XRP’s place in the market—it also reshaped how analysts view signals that precede historic surges.
Today, with new tools in crypto technical analysis and advanced chart-reading strategies, experts are asking the same question: could the market be setting up for another symmetrical triangle breakout that mirrors the past? As 2025 approaches, excitement builds around whether the XRP 2017 Rally Signal might return, hinting at another major price surge and reminding everyone that in crypto, history often finds a way to rhyme.
A Quick Look Back at XRP’s Legendary 2017 Bull Run
Back in 2017, the cryptocurrency market was still young, with Bitcoin (BTC) acting as the guiding light for altcoins. During that time, XRP became one of the most explosive performers, rising from below $0.01 to over $3.5 at its peak. This move was not just about speculation. It was powered by narratives around banking adoption, cross-border payments, and speculation that banks would use Ripple’s technology for settlement.
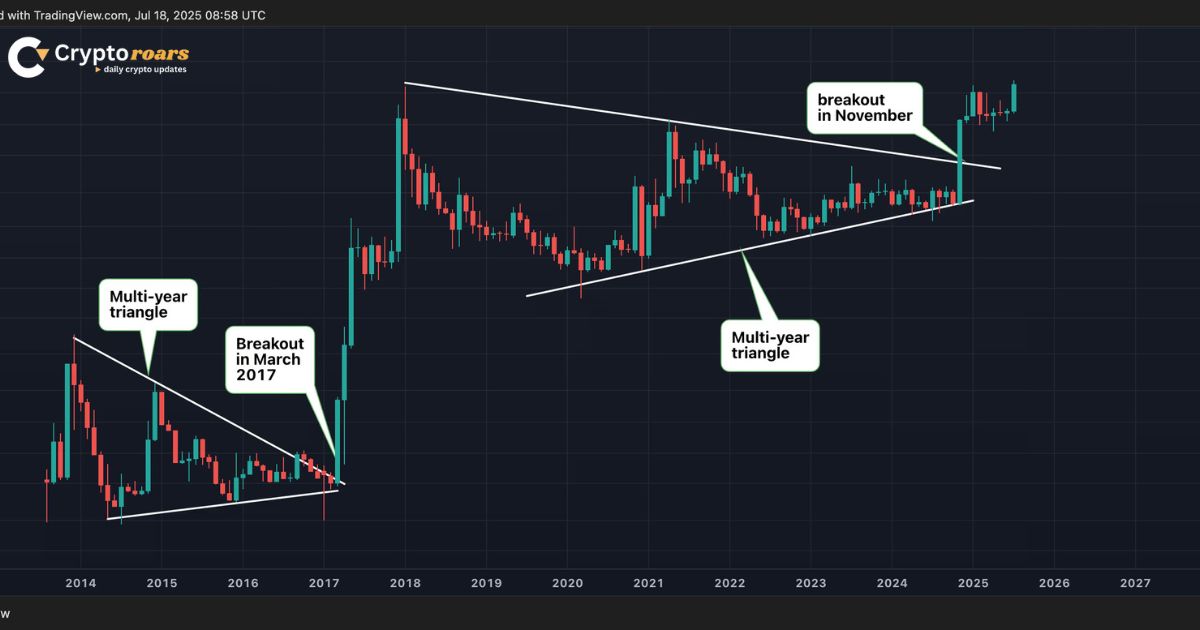
The 2017 rally gave XRP a special place in the crypto world. The surge was fueled by a multi-year squeeze that broke out through a symmetrical triangle breakout, a classic sign of strength in crypto technical analysis. The effect was massive and led to what many call one of the most parabolic rises in crypto history. That rally remains one of the most studied case studies in market cycles.
What is the “Rally Signal” That Sparked XRP’s Previous Boom?
The XRP 2017 Rally Signal is not a mystery. Traders know that the main technical driver was the Stochastic RSI crossing into the RSI overbought levels at the same time as a multi-year symmetrical triangle breakout. This combination confirmed momentum while breaking long-term XRP resistance levels.
The MACD histogram also played a role. In 2017, a rare bullish crossover happened just before the breakout, and Bollinger Bands expansion showed that cryptocurrency volatility was about to increase. Many traders still use this set of signals today, calling it the “XRP rally signal” because of how powerful it proved to be in the last mega run.
XRP Price Today and Market Sentiment
As of 2025, XRP price trades within a trading range just under major resistance levels at $3, $3.4, and $3.5. Market participants are split between optimism and caution. Retail investors in the U.S. see this as a chance to relive the XRP bull run, while institutional players want clearer signals before committing large funds.
Sentiment data shows that CoinDesk analysts such as Omkar Godbole and Parikshit Mishra are watching this setup closely. On forums, traders compare the current state with the 2017 rally pattern. While enthusiasm is high, there is also an awareness that profit-taking zones may appear quickly once XRP breaks above XRP resistance levels.
Stochastic RSI Cross Above 80 – The Spark Returns
The current excitement is mostly tied to the Stochastic RSI crossing above 80, which mirrors the exact move before the 2017 rally pattern. Historically, this signal marks the point where momentum traders flood in, expecting a crypto breakout point.
Traders see this as the official moment when the XRP 2017 Rally Signal Returns. Combined with the tightening multi-year squeeze, this setup has put the market on high alert. If momentum holds, a strong XRP price surge may follow, but if the move fails, it could result in a sharp pullback and a painful XRP price correction.
Comparing 2017 and 2025 Market Conditions
There are important similarities between 2017 and 2025. Both periods show multi-year symmetrical triangle formations, Stochastic RSI momentum, and increasing cryptocurrency volatility. The market also reflects growing confidence as more traders expect XRP consolidation to end.
But there are major differences too. In 2017, the market was dominated by retail traders. In 2025, institutions, ETFs, and regulated exchanges play a huge role. Bitcoin resistance at $120K, the ETH/BTC ratio, and Solana May highs all act as macro signals shaping the altcoin market. This means that while the XRP 2017 Rally Signal Returns, the outcome may not be identical to the past.
Technical Analysis: Breakouts, Death Cross, and Elliott Waves
Technical analysts are focusing on the classic indicators again. The death cross that once appeared before the 2017 rally pattern is back, but history shows that it turned bullish right after. Elliott Wave counts suggest that XRP may be entering wave three, which is historically the strongest move in trending markets.
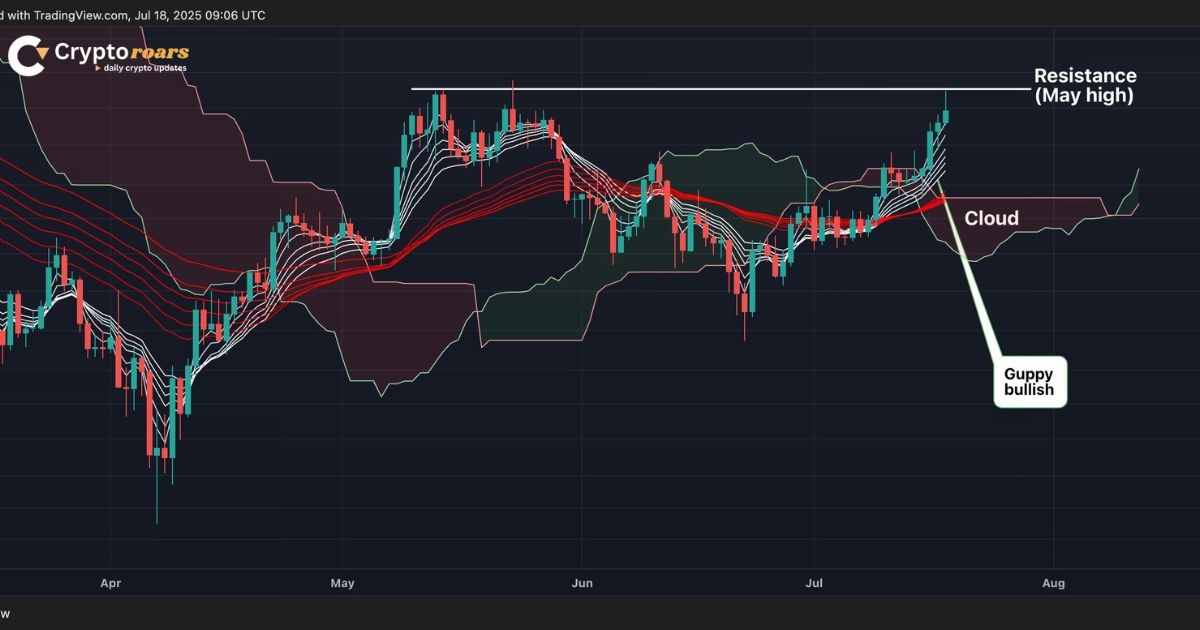
Indicators like the Ichimoku Cloud and the Guppy Momentum Indicator are flashing signs of renewed strength. In simple terms, all these signals point toward a possible XRP price surge if the coin can clear the resistance levels of $2.9, $3.0, $3.4, and $3.5.
| Technical Indicator | 2017 Reading | 2025 Reading | Implication |
| Stochastic RSI | Over 80 | Over 80 | Bullish momentum |
| MACD Histogram | Bullish crossover | Turning positive | Upside risk |
| Bollinger Bands | Expansion | Expansion starting | Volatility incoming |
| Ichimoku Cloud | Breakout | Testing | Possible bullish trend |
On-Chain Data Signals: Are Investors Overheating?
On-chain metrics give another layer of analysis. In 2017, over 90% of XRP holders were in profit during the parabolic run. In 2025, data shows nearly 94% of holders are in the green again, suggesting possible market exhaustion.
Whale accumulation remains a key factor. Recent reports show heavy activity near the $3 resistance level, which may signal either large-scale distribution or strong belief in further gains. Analysts remind investors that such concentration can create both bull breathers and sudden collapses if whales decide to exit positions.
Expert Predictions: $9, $20, or Beyond?
Predictions vary widely. Some analysts believe the XRP 2017 Rally Signal Returns could push prices to $9 in the short term, while others, such as Cathie Wood from ARK Invests, suggest much higher targets, even $20 or beyond, if the rally mirrors the 2017 rally pattern.
Skeptics warn that expecting another parabolic run may be risky. They argue that XRP resistance levels remain strong, and macro conditions like Bitcoin resistance at $120,000 and the ETH golden cross may decide how far altcoins like XRP can move.
Risks to Watch Before Betting on Another XRP Bull Run
The biggest risk is regulatory. The ongoing challenges with the U.S. SEC could limit XRP adoption and slow momentum. At the same time, macroeconomic factors such as interest rates and liquidity can reduce risk appetite across markets.
Technical risks also exist. If RSI overbought levels are sustained for too long, it could create a profit-taking zone. The danger of a broad range play or bullish exhaustion remains high, especially if XRP consolidation drags too long without a strong crypto breakout point.
Final Thoughts – Can XRP Repeat Its 2017 Mega Rally?
The truth is that no one can perfectly predict whether the XRP 2017 Rally Signal Returns will lead to a repeat of the legendary surge. The setup is extremely similar to the past, with Stochastic RSI, MACD histogram, and Bollinger Bands expansion showing momentum. However, the market is very different today, with institutions and regulations shaping outcomes.
For U.S. investors, the lesson is clear: history may rhyme, but it never repeats perfectly. The signals point to a strong chance of a breakout, but risks remain high. Caution, patience, and careful tracking of technical signals will be essential. As the saying goes, “history doesn’t repeat, it rhymes,” and 2025 may prove to be another rhyme in XRP’s fascinating journey.
FAQs about XRP 2017 Rally Signal
1. What is the XRP 2017 Rally Signal?
The XRP 2017 Rally Signal refers to the technical and market conditions that triggered XRP’s massive bull run in 2017, leading to an extraordinary price surge.
2. Why is the 2017 rally pattern important today?
The 2017 rally pattern helps traders identify possible setups for future bull runs by comparing old signals with current crypto technical analysis trends.
3. Can XRP repeat its 2017 performance in 2025?
While nothing is guaranteed, indicators like the symmetrical triangle breakout and rising market momentum suggest that history might rhyme, even if it doesn’t fully repeat.
4. What price levels should traders watch?
Key XRP resistance levels include $3.5, $3.4, $3.0, and $2.9. Breaking these could spark another strong rally.
5. How do indicators confirm the rally signal?
Tools like RSI overbought levels, MACD histogram, and Bollinger Bands expansion help confirm whether XRP is preparing for a bullish breakout.
6. Should investors trust expert predictions?
Experts give targets like $9 or even $20+, but traders should also watch risks like cryptocurrency volatility and bullish exhaustion before making decisions.
For more information, keep visiting cryptoroars.com